
The last decade has witnessed an extraordinary rise in private equity investments in the technology sector. From startups disrupting industries to tech giants expanding their empires, the story of tech M&A is one of resilience, innovation, and unprecedented growth.
By layering exclusive insights from DealEdge, deal benchmarking analytics platform, and SPS by Bain & Co., a deal sourcing analytics platform, we can deeply analyze the robust performance and vibrant deal activity that have made technology a standout sector. In this deep dive, you’ll learn: which EV range is delivering the highest returns, the tech sub-sector that is outperforming the others, and why there might be a surge in tech M&A opportunities in the near future.
Leveraging DealEdge to Evaluate Deal Performance
Using the DealEdge platform, we can discern the performance of technology deals across various enterprise value (EV) ranges from 2014-2024 (year to date).
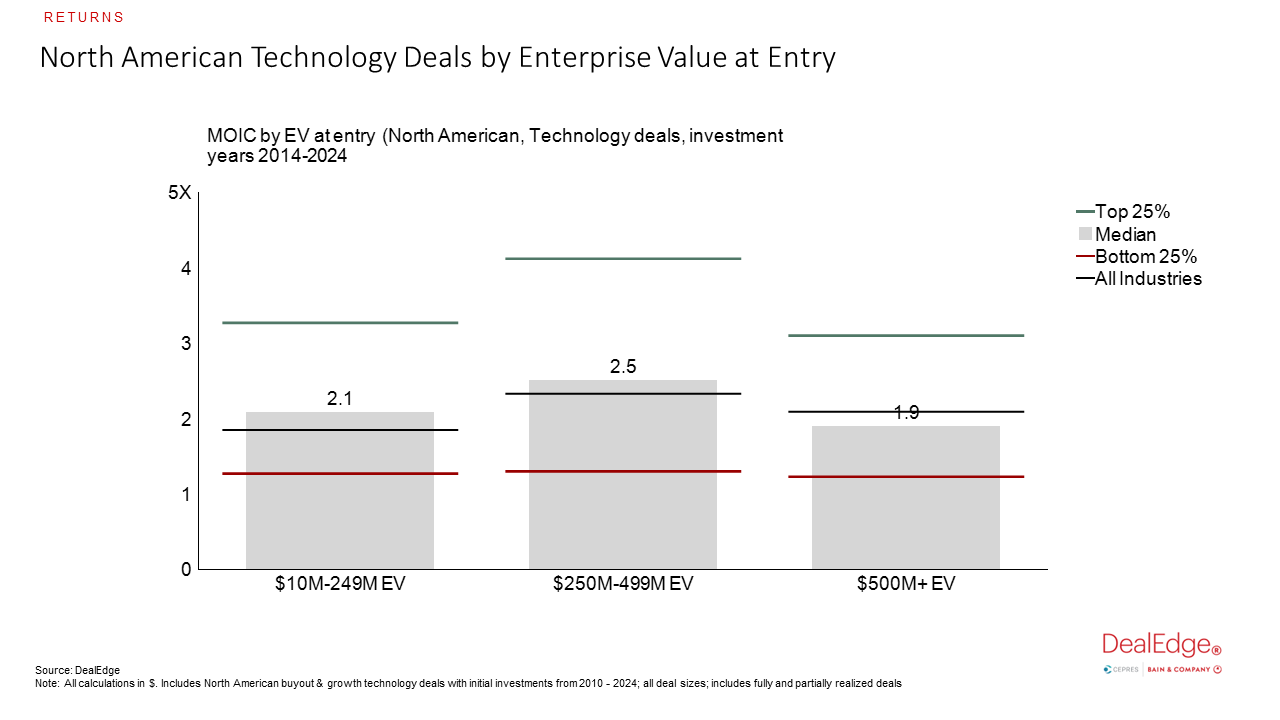
Technology deals with an EV at entry of $250-$499 million between 2014 and 2024 boast the highest overall returns, with a 2.7x gross median multiple on invested capital (MOIC) and top quartile deals delivering an impressive 4.1x return. Notably, technology transactions within the $10-249 million and $250-499 million EV ranges consistently outperform the ‘All Industries’ median, while deals exceeding $500 million in EV have underperformed relative to this benchmark.
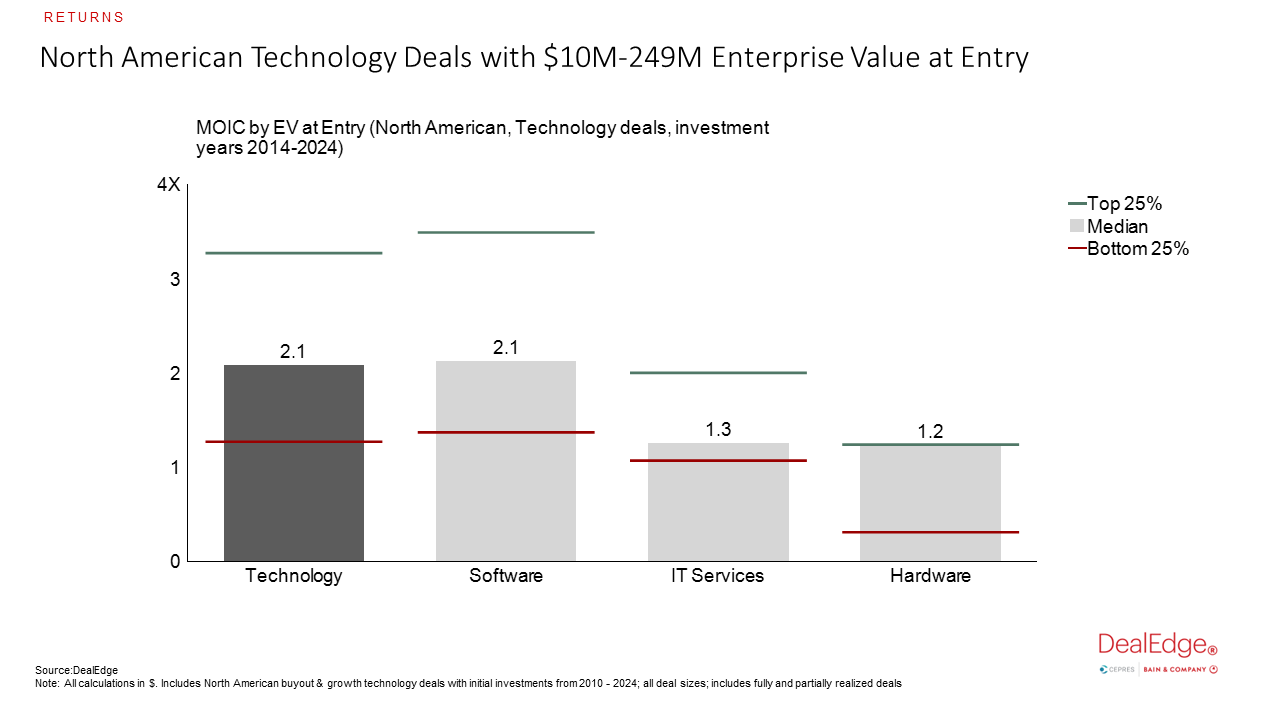
The true power of DealEdge, however, lies in its granular insights into sub-sector performance, revealing the specific areas driving overall technology returns. For deals under $249 million in EV, the software subsector emerges as the highest performer at the “L2” level of Bain & Co.’s proprietary industry taxonomy, matching the overall “L1” technology sector with a gross median MOIC of 2.1x and top quartile returns of 3.5x. In contrast, hardware lags behind with top quartile returns of only 1.2x.
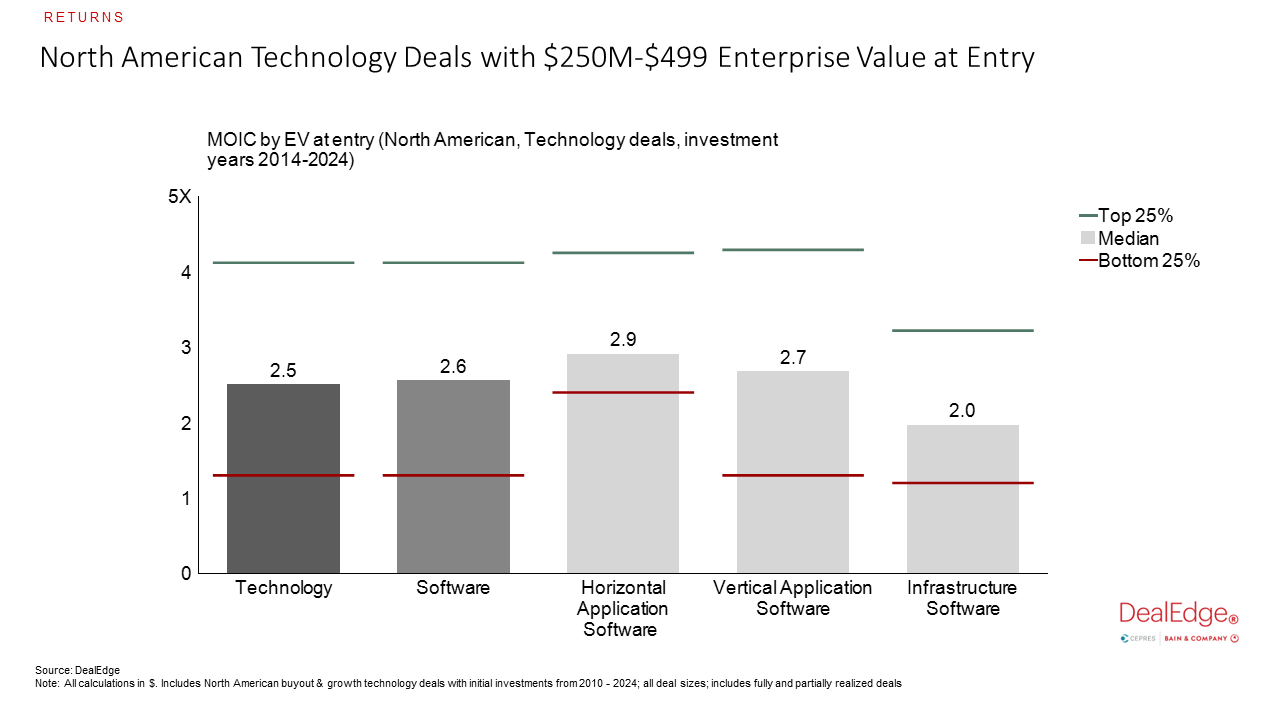
Software maintains its position as the leading sub-sector within the $250-499 million EV range, delivering a 2.6x gross median MOIC. Although the sample size for hardware or IT service deals in this range is limited, further analysis at the “L3” level reveals that horizontal and vertical application software subsectors drive the highest returns, with gross median MOICs of 2.9x and 2.7x, respectively. Top quartile transactions in these sub-industries achieve over 4x returns, aligning with the overall technology sector. Meanwhile, infrastructure software deals show a 2.0x median return, with top quartile deals yielding a 3.1x return.
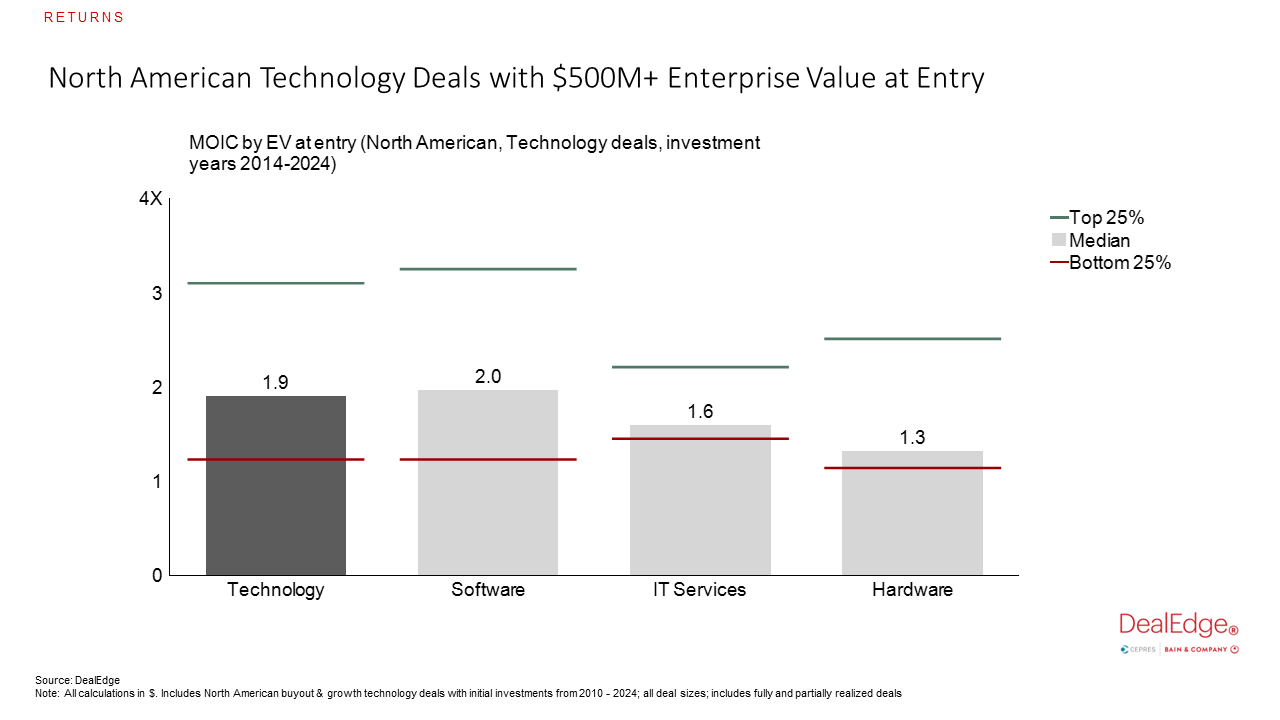
For deals exceeding $500 million in EV, software once again outperforms the broader technology sector, with a median return of 2.0x. In contrast, IT services and hardware deals fall short of the overall sector median, with less significant differences in top quartile returns.
DealEdge’s detailed benchmarking capabilities are essential for navigating these nuances and pinpointing the most promising investment opportunities within each technology sub-sector and EV range.
SPS Data: Trends in Tech Deal Activity
To fully grasp the technology M&A landscape, it’s essential to look at both deal performance insights and deal activity trends. Analyzing SPS data reveals critical trends in tech deal activity over the past decade.
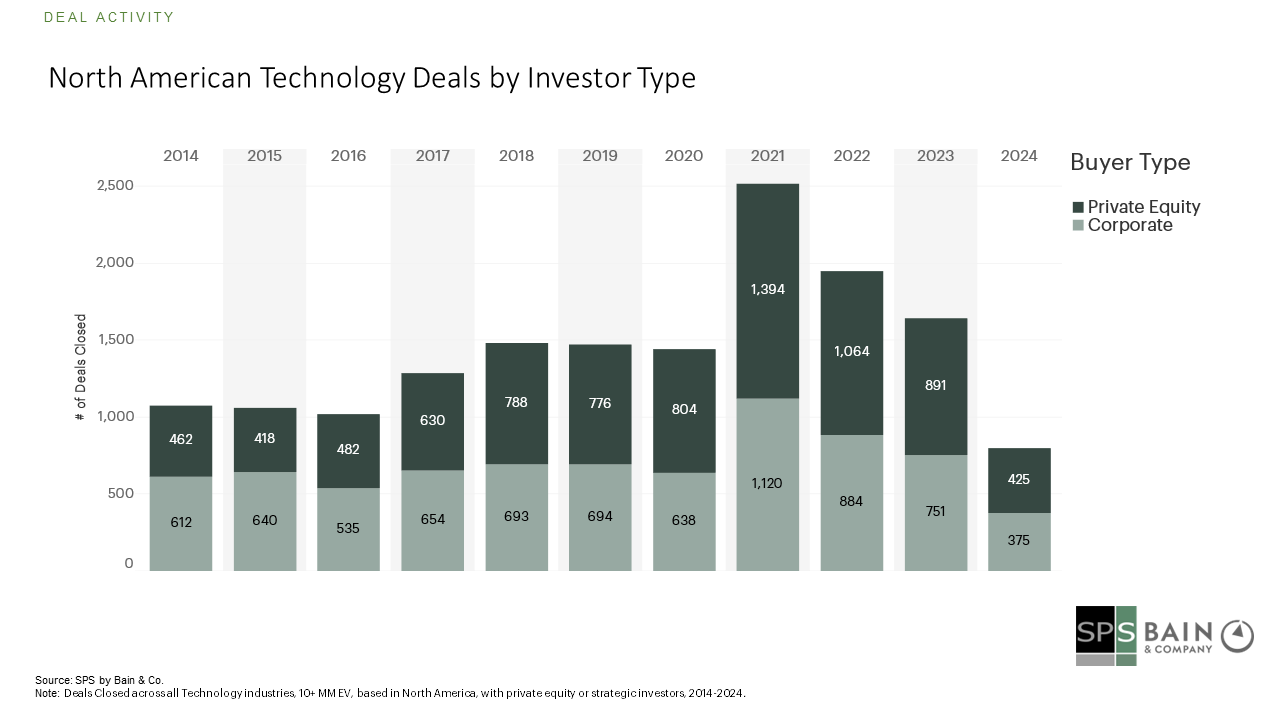
Corporate activity dominated tech M&A until 2021, when private equity surpassed corporate transactions. This trend continued, with private equity accounting for 54.2% of tech deal volume in 2023.
Two factors contributing to private equity’s dominance are the rise of sector-focused and add-on strategies. The past five years have seen a shift toward the buy-and-build method, focusing on smaller add-on acquisitions to bolster existing platforms.
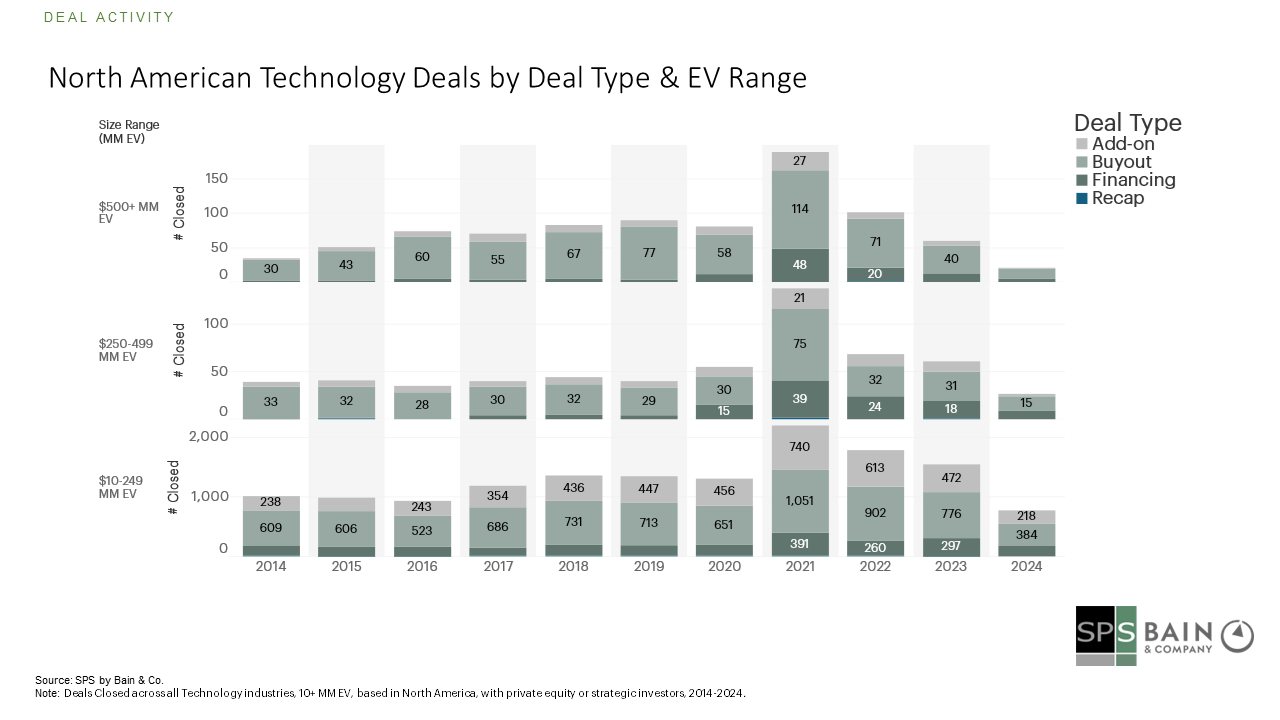
Buyouts remain the largest portion of deal volume but have diminished in lower EV ranges. In the $10-249 million EV range, add-ons increased to 30.6% of deal volume in 2023 from 23.8% in 2014.
Since the COVID-19 pandemic, financing transactions in the tech sector have surged. In the $250-499 million EV range, financings significantly overshadowed add-ons, representing 28.8% of deals in 2021 and continuing to outpace add-ons since.
For deals above $500 million EV, financing deals have markedly increased since 2020, while the proportion of add-ons has remained consistent. In 2021, financings accounted for 25.4% of overall tech deals in this size range.
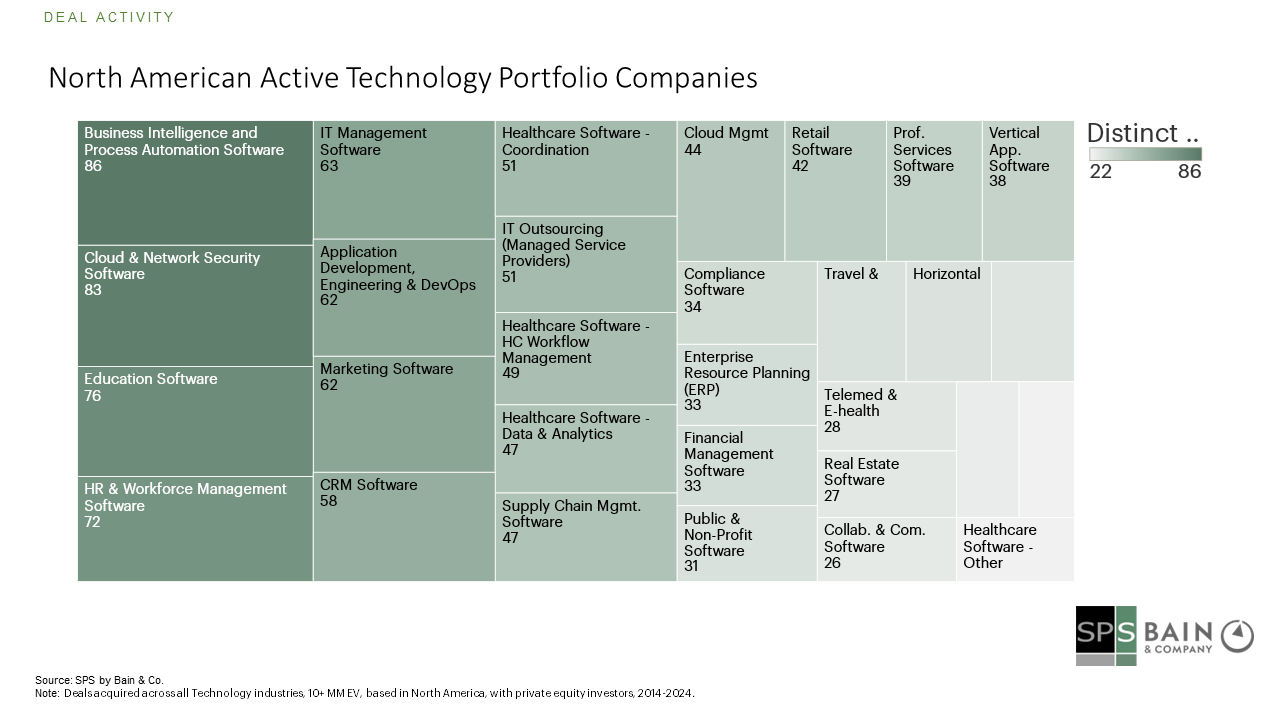
PE-owned assets represent key opportunities, particularly within emerging sectors. According to SPS data, 24% of the 1,341 active tech portfolio holdings acquired between 2014 and 2021 fall into four sub-industries: Business Intelligence and Process Automation Software, Cloud & Network Security Software, Education Software, and HR & Workforce Management Software.
The latest SPS PE Harvest report shows that the median holding period for active portfolio holdings has reached a record high of five years. Coupled with high levels of dry powder, this suggests a surge of relevant target acquisitions in the coming years, with tech holdings representing a significant share.
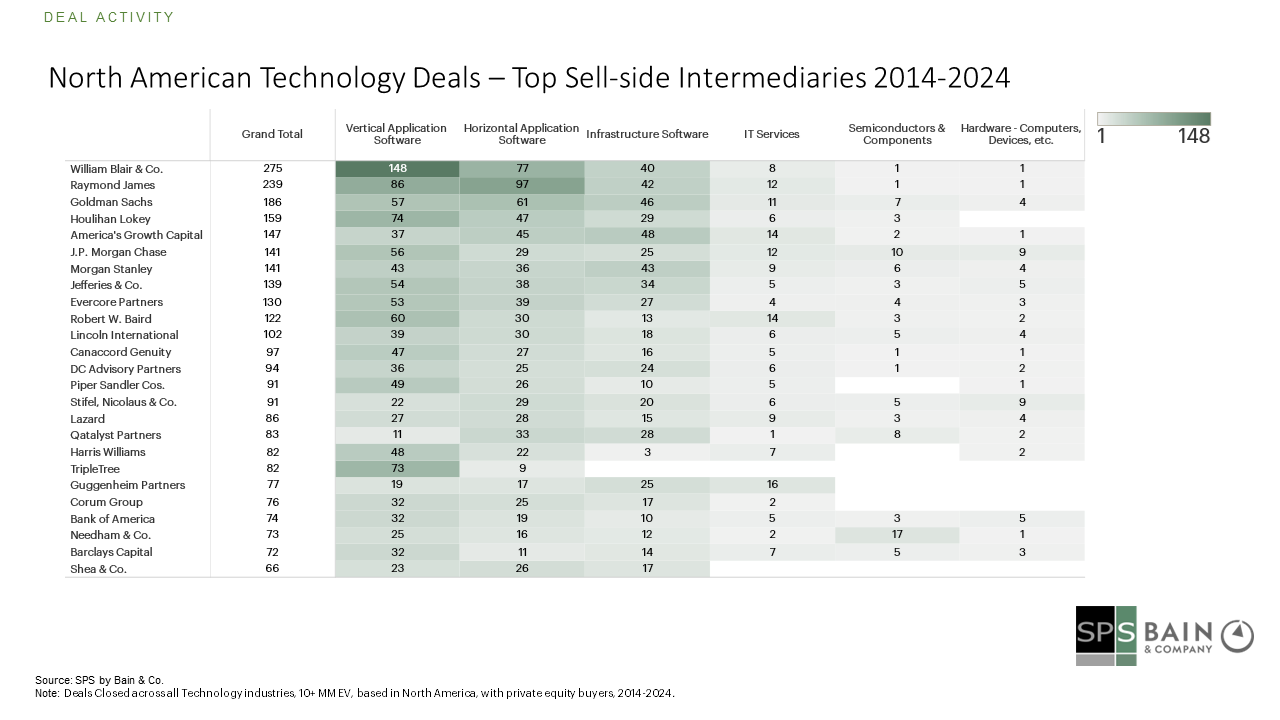
From 2014 to 2024, the top sell-side intermediaries in the tech sector include William Blair & Co., Raymond James, Goldman Sachs, Houlihan Lokey, and America’s Growth Capital, with many deals concentrated in the vertical application software industry.
Tech M&A has become a hotbed for investors seeking substantial growth and consistent outperformance. These findings underscore the technology sector’s ability to generate strong deal activity and impressive performance across transaction sizes and subsectors. As private equity continues to dominate and opportunities within sponsor-owned assets rise, the tech sector remains fertile ground for compelling investment opportunities and sustained success.