
This is Part 2 of a two-part series on investor demand insights from H1 2021. Read Part 1 here.
By investigating the pandemic’s impact through the lens of the chart below, we can assess its implications for PE deal sourcing. In last year’s edition, we predicted that closing rates were poised to decline because so many deals coming to market pre-Covid stalled or were permanently sidelined. This indeed turned out to be the case, with the median percentage of deals seen by PE firms in the first quarter of 2020 that actually ended up closing coming in at 22%, compared to 29% for the comparative period of the first quarter of 2019 in last year’s chart. Capitalizing on the trend of stalled or broken deals, SPS clients were able to automatically monitor and follow up on deals in their pipeline that they considered attractive and didn’t trade. They could access this information right from their SPS Portal dashboard as well as through programmatically generated weekly email reminders.
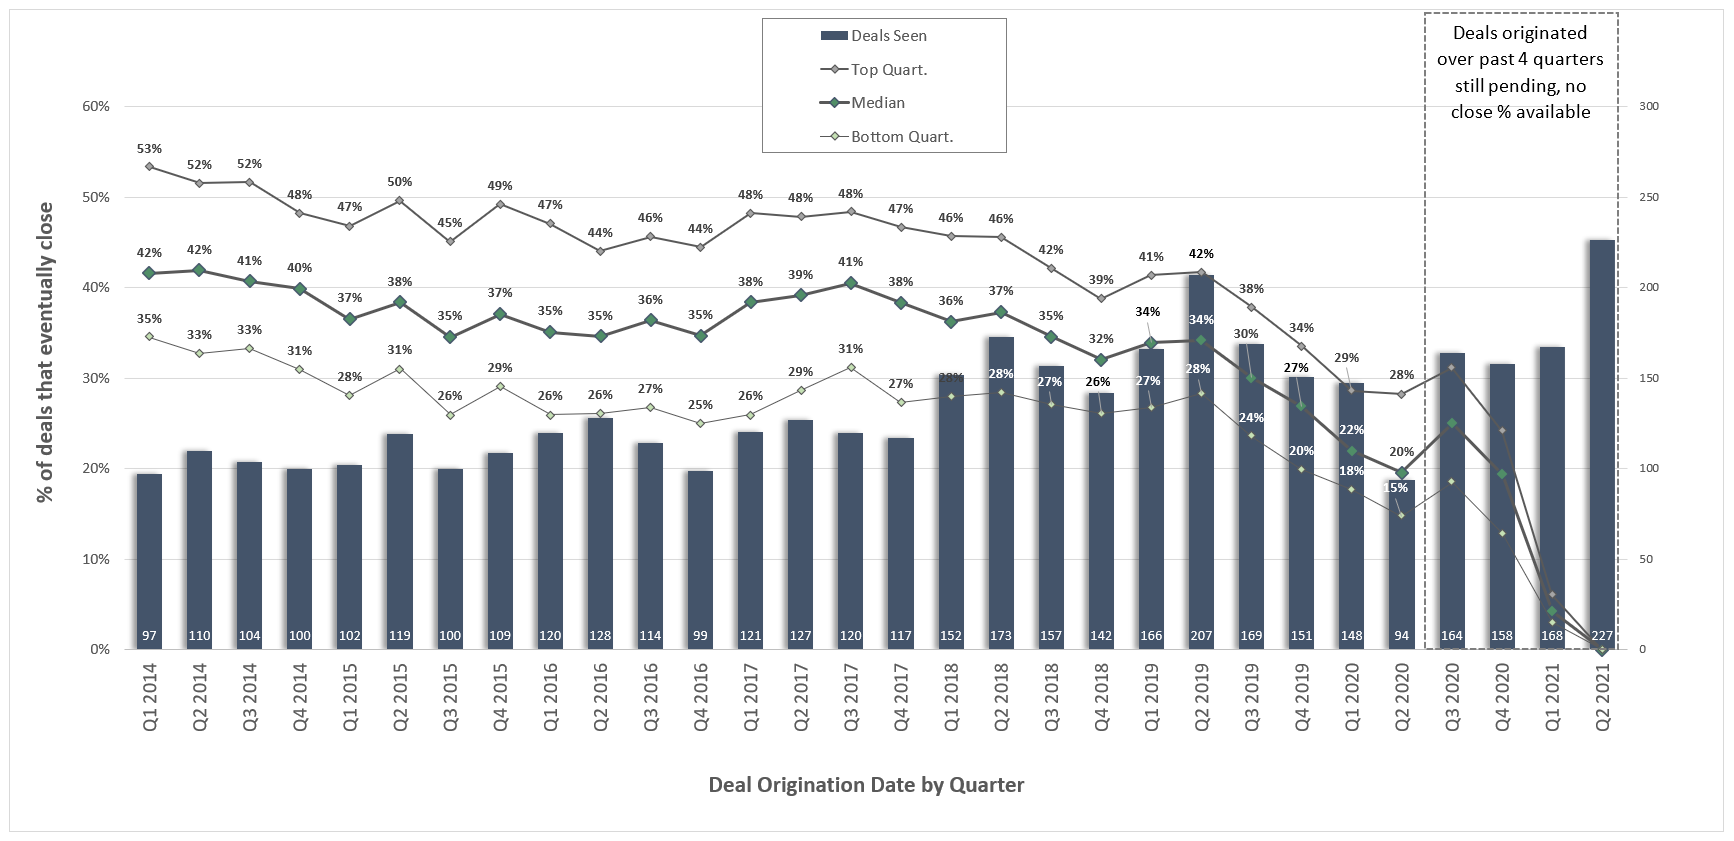
PE Deals Seen vs. Percentage Closed
Given last year’s disruption in the market, getting the most current contact data and any new quality intermediaries added to your CRM will be key, ideally with minimum manual effort through plug-ins and direct data feeds. According to SPS data, over 310 intermediaries that were active in 2019 did not close a deal in 2020, and more than 120 firms in 2020 closed a deal for the first time. In-person conferences are also picking up, and SPS’s recently-launched Conference Evaluator tool allows professionals to simply copy and paste an attendee list from any event and generate a customized analysis within seconds that prioritizes the most relevant firms to meet with based on their investment criteria.
Another trend emerging over the past few years, which current market conditions may perpetuate, is the willingness of PE firms to buy the portfolio holdings of their fellow sponsors. The SPS Client Portal makes direct-to-sponsor sourcing of relevant targets easy to track and highlight. According to SPS data, more than 5,000 companies that were acquired by PE firms between 2000 and 2017 are still being held and may trade again soon, with services, industrial, and IT companies representing a little more than 60%. Investors who wish to sharpen their focus on portfolio companies with the highest likelihood to exit soon can adjust filters such as maturity and sector to identify the most relevant opportunities.
Finally, with purchase multiples showing no signs of reprieve in 2021 and record dry powder, PE add-ons and the “buy and build” strategy are gaining momentum. Accumulating smaller assets at lower entry multiples in a well-defined thematic sector will allow investors to boost returns when it comes time to exit at higher levels due to multiple expansion. In fact, the add-on-to-PE ratio has accelerated to an astounding 2.4 add-ons per each new platform YTD 2021, up from 2.1 in 2020 and 1.4 in 2015, according to SPS data. The fragmented landscape of potential deal sources representing smaller deals often running less efficient processes is a great opportunity for PE firms to build their networks and unlock immense value in their portfolios.
Download the slides from our recent webinar for a full-scope look at PE and M&A deal origination in Q1 2021.
Photo courtesy of Unsplash
Chart generated from SPS proprietary data