
In a deal environment marked by more competition, longer hold periods, and rising expectations from LPs, business development can no longer run on relationships and intuition alone.
Private equity firms are increasingly turning to data-driven strategies to improve sourcing efficiency and sharpen their competitive edge—but success depends on more than just collecting data. It’s about knowing which metrics matter and using them to inform high-impact decisions.
The latest SPS Origination Benchmark Report for the full year of 2024, based on data from 176 private equity firms across eight peer groups, offers a valuable window into what high-performing BD teams are doing differently—and how firms can use data to improve coverage, efficiency, and conversion.
The Shift Toward Data-Driven Origination
We’re seeing a growing shift in how firms define success in origination. It’s no longer just about how many deals come through the door—it’s about whether you’re covering the right market, working with the right intermediaries, and converting opportunities efficiently.
That means tracking performance with purpose.
Anecdotally, many firms believe they’re seeing “enough of the market.” But without visibility into how their coverage compares to relevant peers, they risk missing opportunities—or spending time on deals that were never the right fit.
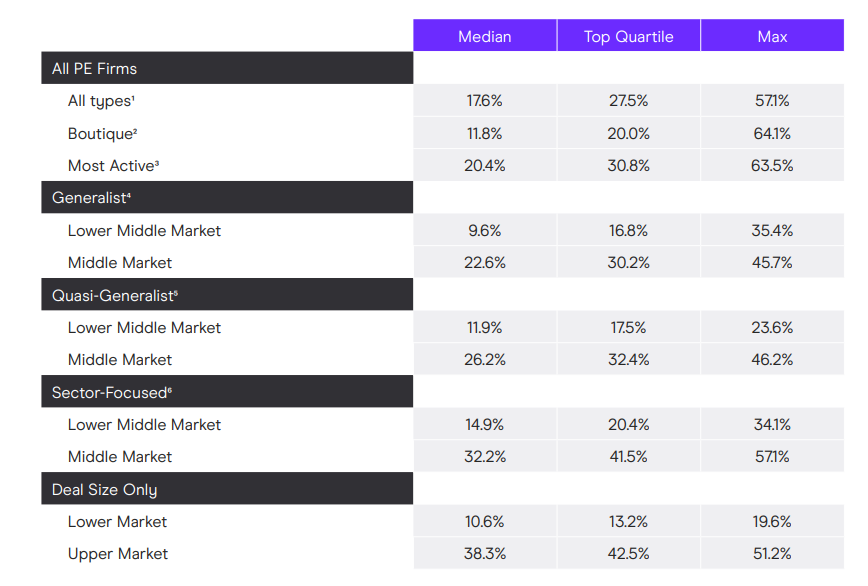
Origination Benchmark Report (Full Year 2024) Median Market Coverage by Peer Group

Key Metrics That Drive Better Business Development
From our work with hundreds of PE firms, here are the most valuable metrics top teams are tracking—and what they’re learning from them:
1. Annual Deal Flow
Breaking down volume is table stakes—but the leaders are analyzing deal flow by seller type, source type, and sector relevance to ensure time is spent on high-fit opportunities.
2. Number of Active Deal Sources
Firms that understand the breadth and concentration of their advisor relationships can better allocate outreach and track source-level ROI. The best teams are also measuring how many new sources are being added annually—and which ones are converting.
3. Conversion Rates
Measuring how deals move through the funnel—from initial review to LOI to close—is critical for spotting bottlenecks and recalibrating outreach strategy.
4. Market Coverage
One of the most overlooked, but essential, metrics: What percentage of your target market are you actually seeing? The 2024 report reveals the median market coverage across all firms was 17.6%, but peer group variation is wide—highlighting the importance of benchmarking against the right cohort.
Turning Metrics Into Strategy
Tracking these KPIs isn’t just about operational reporting—it’s about shaping smarter strategies:
- Where is BD time being spent vs. where it’s most effective?
- Are you under-indexing in key sectors or missing high-performing intermediaries?
- How can conversion trends inform pipeline quality and forecasting?
Top-performing firms are using these insights to adjust resourcing, refine advisor outreach, and align the entire deal team around measurable performance goals.
Benchmarking That Brings It All Together
The latest Origination Benchmark Report delivers not only key sourcing metrics, but also peer group benchmarks that allow firms to contextualize their performance and identify meaningful areas of improvement.
It’s a tool for BD leaders, deal teams, and firm leadership to have a shared view of performance—and a roadmap to doing better.
Download the full report here. And if you’re interested in a customized readout based on your peer group, request one here—we’re happy to share the data that’s most relevant to your strategy.