
All too often a private equity firm deems a deal as irrelevant when they learn it went to a corporate investor. If not information-driven, the leap to this conclusion may involve some common misconceptions that can lead to unintended miscalculations when devising your deal sourcing strategy.
Strategic investors’ historical edge in closed deal activity over PE investors has narrowed, prompting a steady tug-of-war for deals between the groups in recent years. With M&A deal volume pumping across the board, we’re diving into our YTD data to quantify deal activity trends between active PE and corporate investors.
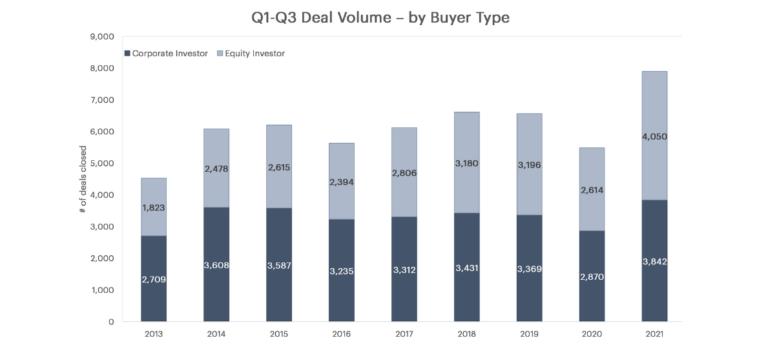
As of Q4 2021, overall YoY M&A closed deal volume is up 44% from the lull of 2020 and 20% from already-robust 2019 levels. This unfolds to a 55% increase in PE deal activity and a 34% increase in corporate activity from last year. Since 2019, deal activity has jumped by 27% and 14% for equity and corporate investors, respectively.
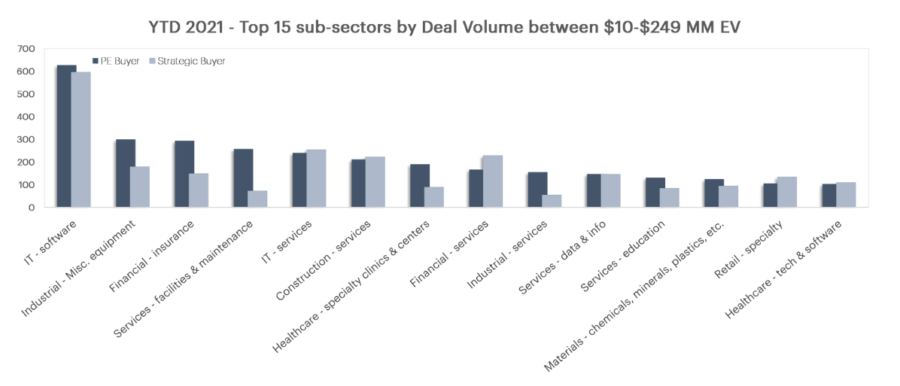
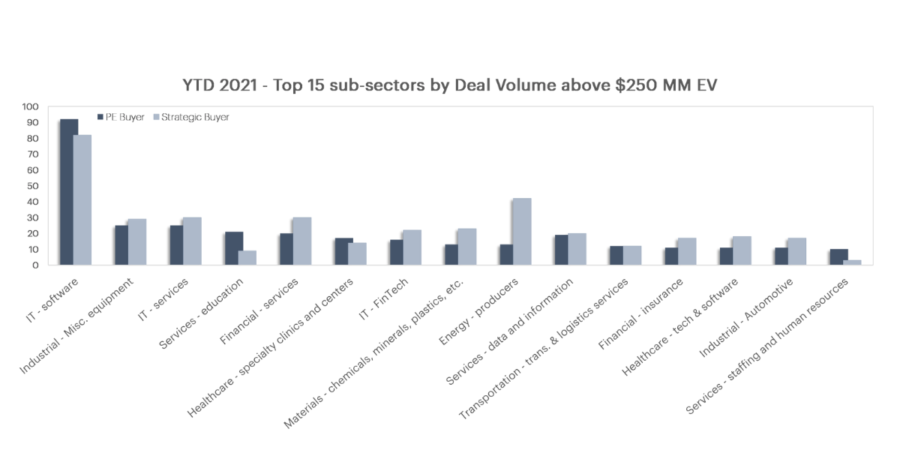
Accounting for some of PE’s recent boost in deal volume is activity under $250 million enterprise value. According to SPS, by Bain & Co. data, PE interest in smaller deals has piqued this year, most evident in the Industrial Equipment, Financial Insurance, and Facilities & Maintenance Services sectors. Conversely, corporate investors are encroaching on deals of over $250 million enterprise value, dominating in the Energy Production industry as well as some Financial sectors.
The charts below break down deal volume between equity and strategic investors across sectors, compared between EVs of above and below $250 million.
With SPS’s unique Sell-Side Process Index, buyers can take a data-driven approach to evaluate the level of competition on deals.
As a private equity firm, a deal that matches your target criteria that went to a strategic buyer does not necessarily indicate the deal was not relevant for your fund. Sell-side process information on transactions or active intermediaries in your target market may suggest an opportunity missed. While it may not be alarming to miss a limited-auction deal closed to a strategic investor, missing a relevant deal that was broadly shopped may mean you need to expand your network of intermediaries.
According to SPS by Bain & Co. data, of the intermediated deals closed in 2021 YTD, 33% were broad process, 23% were moderate process, and the remaining 44% were limited process. 13% of strategic buyer deals were moderate processes, and 21% were broadly auctioned. For PE firms who missed out on these, knowing who the active intermediaries are in transactions matching your investment criteria can inform the efficient allocation of your firm’s business development resources.
PE firms that are differentiating themselves today are leveraging data analysis technology to supercharge their deal sourcing agility by targeting specific deal sources and centers of influence that are actively closing deals most relevant to their investment criteria. Such transparency can be revealed using tools like the SPS Sell-Side Process Index, with applications on both the transaction and intermediary levels. This tool can be used to classify the type of closing process executed by intermediaries on a relative basis and includes a scale for Relevant Deal Activity and Coverage – allowing a deal originator to evaluate the number of relevant deals that a given intermediary closed based on a pre-defined target market.
An accurate perception of the types of sell-side processes typically run by active intermediaries in your target market is crucial to gauging your competition with corporate and PE investors and calibrating your deal origination efforts at large.
Charts generated from SPS proprietary data