This blogpost is a summary of insights and trends analyzed in our 2022 Deal Sourcing Playbook. Download the full guide here.
The SPS 2022 Deal Sourcing Playbook is here. Each year, we publish a collection of market trends, data analysis, and business development resources designed to help private equity firms navigate the ever-variable deal sourcing terrain for the year ahead. Targeted with actionable intel, the guide provides strategic insights as well as tactical recommendations that offer some well-informed inspiration for your 2022 origination efforts. And we’re breaking down key areas of focus right here on The Source.
State of the Market
Following a steady uptick in closed deal volume over recent years, private equity represented the greater share of overall M&A activity in 2021 with 52.3% of total closed deal volume – outpacing Corporate buyers for the first time, according to our data. We’ll monitor this trend closely to see if it continues into 2023 and beyond, or if this was a one-time anomaly.
Industry Breakdown
A closer look at PE versus corporate activity compared by transaction ranges reveals that Private Equity’s greater share in 2021 coincides with a higher volume of closed deals between $10 to $249 million in enterprise value in most industries – though the Financial, Consumer, Retail, Media, and Energy sectors deviated from the trend with strategic buyers coming out on top. Conversely, corporate buyers took the lead for deal activity in transactions above $250 million enterprise value – apart from the Services sector, which was won by PE.
A deep-dive of SPS’s Sell-side Process Analysis reveals that almost half of corporate acquisitions in the $50-$999 MM EV range were also shopped to prospective PE buyers, highlighting the ongoing competition between PE firms and corporate buyers. Of deals that closed to PE firms, the majority with EVs between $50 and $999 million were broadly shopped.
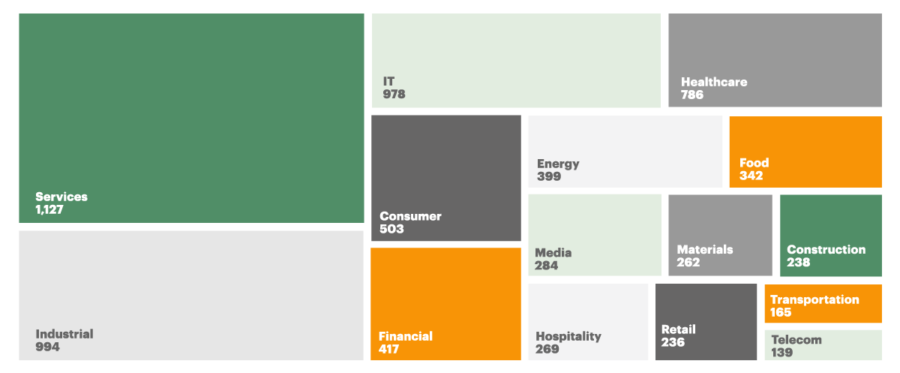
All told, the Services, IT, Healthcare, and Industrial sectors once again led the way in overall M&A activity in 2021. While activity across all sectors increased last year compared to 2020, these frontrunners saw the most significant growth in deal volume.
The SPS PE Portfolio Harvest shines a light on over 5,100 companies that originally traded to PE firms between 2013 and 2018 that are still being held today and may trade again soon, with most in the $10 million to $49 million EV range and falling in the Services, Industrial, IT, and Healthcare sectors. The guide also indicates the sponsors with the greatest numbers of active portfolio holdings, with KKR & Co, Carlyle Group, and H. I. G. Capital leading the pack.
Understand the M&A Ecosystem
In this section, highlighting the Industrial sector as a sample target, we map out a PE investor’s journey utilizing the SPS portal to sharpen their focus on deals relevant to their investment criteria. By using a sector-specific search, filtering by transaction values, and excluding deals without intermediaries, our sample fund has narrowed their scope of deal data from over 27,000 transactions in our database during the specified period to a much more targeted 771 relevant deals. From here, we run a report of the most active Intermediaries, PE Buyers, and Senior Lenders involved in those deals to get a more dynamic picture of major players in our investment universe.
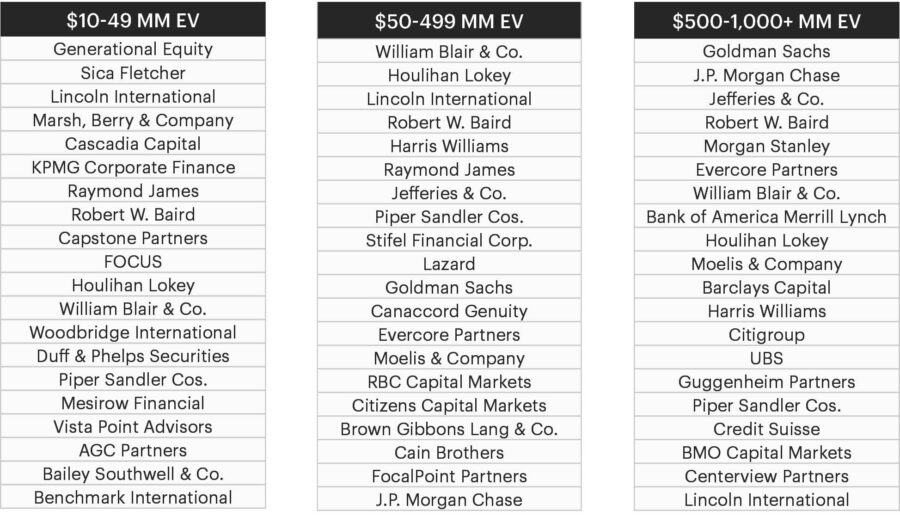
Zooming out to a broader view of the market, we reveal the top intermediaries for to PE firm buyers in 2021, broken out into several market segments, according to SPS data.
Travel is Back
As business travel stages its big comeback, PE firms and strategic buyers are looking to resources like the SPS Travel Planning tool to inform a safe and targeted strategy. The feature allows a firm to prioritize top locations for advisors closing deals in their target criteria, and sort by the number of active professionals at a specific branch location for optimal accuracy and efficiency.
2022 Product Roadmap
What’s on the horizon for SPS? We’re glad you asked.
Our new Industry Taxonomy is being introduced in Q2, including an upgrade to our historical database of over 80,000 transactions designed to enhance functionality and accuracy across the entire platform, including SPS Alerts, Market Coverage, and sector-level analyses. It also facilitates industry deep dives, niche advisor queries, fund strategy research, and other specific tasks. Key new features enable filtering by four defined tiers and over 560 options at the sub-industry level, improve searching with primary/secondary structure for deals with multiple tags, and make “business function” queries across all sub-industries for distributors, operators, producers, and more.
A Clear Path Ahead
Sourcing deals is tough and time-consuming, and data makes it easier. Our goal is to equip our clients with the right data, presented in the right ways to inform an effective sourcing strategy in any market environment. Now armed with intelligent analysis and a dynamic lens, we hope this guide inspires your firm to inspect your own approach to deal origination from a fresh perspective.
All data generated by Sutton Place Strategies, by Bain & Company in February 2022