
Each year, we publish an outlook on private equity deals in the quarters ahead through the lens of a proprietary analysis of historical activity – unique to SPS data alone.
By all counts, 2021 was an unmatched year for PE deal activity. As firms turned out deals at a groundbreaking rate, our team was occupied with an unceasing volume of closed deals to track. Setting the stage for this perfect storm of 2021 deal activity were three key factors: A flurry of quality deals that stalled during the onset of the pandemic finally met a healthy investment environment. Due to that COVID-era lull, PE firms had an abundance of dry powder ready to deploy. And the threat of a proposed hike in capital gains tax triggered privately held companies’ motivation to sell before it was too late.
According to SPS data, 2021 saw a grand total of 11,974 North American M&A deals, with each consecutive quarter breaking new all-time highs in deal counts. This was a 34% increase from pre-pandemic levels in 2019. Deals closed by equity buyers accounted for 52.3% of the total, representing the first time on record that PE outpaced corporate investors for the greater share of M&A deal activity. This triumph for PE is attributable to overall market share in deals below $250MM in enterprise value (EV), while strategic investors led the charge for deals above $250MM EV. The hottest sectors for sponsor investment were Services, IT, Healthcare, and Industrials, respectively.
While 2021 was a tough act to follow, 2022 was off to a close start with first quarter deal counts being the highest on record for that period. However, what looked to be a continuation of the prior year’s pattern soon took a turn, with Q2 numbers crawling in at an 18% drop from the previous quarter. Several adverse factors such as rising interest rates, geopolitical strains, and the prospect of a recession have influenced this temporary loss of appetite for deals.
Current market conditions have spurred a whirl of discourse around the fate of 2022 transaction activity. So, what is in store for the remainder of this year in terms of closed deals? If the past is in some part an indication of the future, let’s look to SPS’ proprietary analysis of historical deals launched versus those that end up closing.
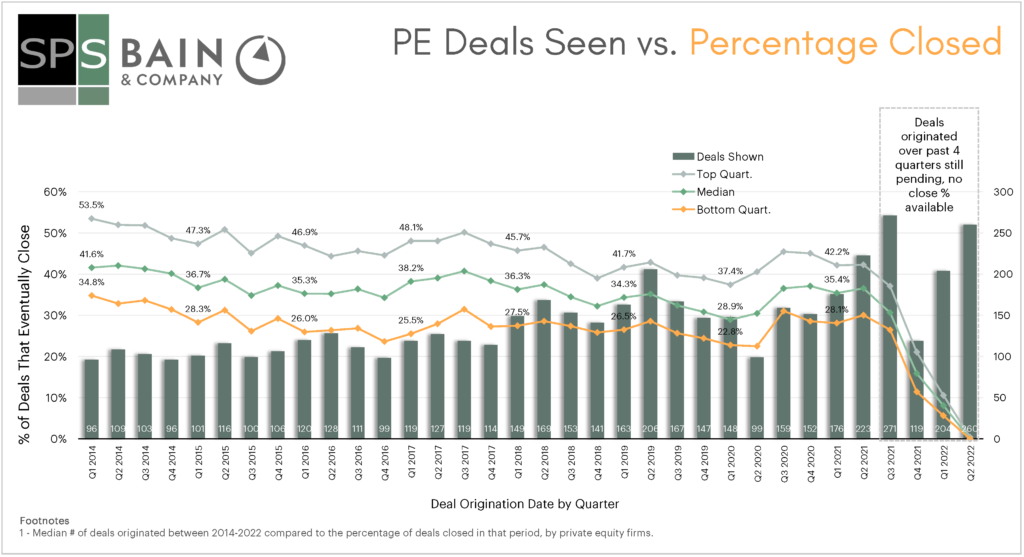
In the chart above, quarterly PE median deal flow (columns) is compared to the percentage of those deals launched that eventually close (lines). After a drop in deal flow in the first half of 2020 due to COVID, deals sourced steadily increased from Q3 2020 until Q4 2021, when a palpable decline in deal flow occurred. On average, since 2014 about 36% of deals sourced end up trading at all, though this proportion has slightly declined over time, and dropped to 30% at the peak of the pandemic as broken and stale deals amassed. As this represents the most significant period of economic uncertainty in recent memory, perhaps in today’s downturn environment, closed deal volumes will follow suit.
On the contrary, the proportion of deals that end up closing has stabilized to match – and even surpass – pre-pandemic levels, with the median closing percentage in Q2 2021 at 37%, compared to 29% in Q1 2020. This implies a trend of high closed deal volumes whenever deal flow is robust. And despite current circumstances, deal logs are showing no sign of slowing down. Median deal flow in Q2 2022 was the highest for this period on record, and top originators have even expressed optimism as deal flow is maintaining high quality.
There are, of course, other factors at play that could affect this outlook, such as the trend toward broader auction processes. If deals are being shopped more competitively, they could be showing up in more firms’ pipelines, effectively skewing the count of deals sourced. In this case, firms can still take steps to edge out the competition. Using technology and automation tools like SPS’ Pipeline Analysis and Broken Deal Alerts features, firms can monitor the trading status of relevant assets they’ve identified – as well as the individual intermediaries involved with them – to move swiftly when opportunities resurface.
With today’s level of intermediary churn, more than ever, it is critical to have an efficient system to enrich CRM data to keep contacts current as well as regularly add new ones. According to our data, over 270 intermediaries that were active in 2020 were not active in 2021, and over 160 firms sold a business for the first time in 2021. PE firms can combat high churn rates with SPS’ CRM Integration tool to automatically update CRM data to eliminate staleness, streamline outreach, and maintain a robust deal-sourcing operation.
Also, as conference attendance continues its momentum, SPS’s Travel Planning and Conference Evaluator tools allow professionals to upload contact lists and generate a customized analysis that ranks the most relevant firms to meet with based on specified investment criteria.
Conjecture around 2022 deal volumes aside, it’s not over till it’s over. As long as deal flow is strong, firms with a streamlined approach to CRM upkeep, dynamic relationship-building efforts, and a technology-enabled sourcing structure have potential for strong deal closing rates in the quarters to come.
Photo courtesy of Unsplash.